

Do you understand the difference between data and insights? Are you really understanding your data, or do you have surface-level knowledge that can be improved?
In an Adweek article by Anastasia Leng, she warns against doing the same thing multiple times without ever “validating if it’s having the intended result.” Leng says many have easy access to metrics without the right tools to differentiate them.
Simply put, just because something can be measured doesn’t mean that data should make the decisions for you. Be careful about what insights you use to weigh in on your decision making.
Data vs. Insights
Genius Monkey COO Travis Champ said that many marketers like to use buzzwords and say they want more data and more insights, but they actually don’t take the time to understand what that means.
“Many digital marketers constantly ask for more data, get more data, but then don’t take the time to dive into what the data means or turn it into actionable insights and changes,” Champ said. “What we want advertisers to avoid, is the potential pitfall and time sink of collecting excessive data just to have it, and not having the ability or tools to get the reliable insights they need from the data.
Data can be defined as numerical and statistical information you receive from your marketing or advertising efforts. It can come in the form of massive data dumps of numbers in spreadsheets, basic reports, and complex metrics you may get weekly, if not daily.
Insights, on the other hand, do not have a one-size-fits-all definition. Insights are more valuable than basic data—insights help guide actionable decision making across your organization. With insights, you have a deeper understanding of data in a way that you can decipher what results are most important to your efforts.
How to Better Understand Your Data
Leng wrote that companies who don’t understand data can look at 10 advertisements and see that the one with the best click-through rate had lemons in it, so they’ll claim lemons increased the click-throughs for that ad set. This ignores various other factors that could have caused the higher click-through rate.
So when is something statistically significant? One way to determine that is to watch for repeatability. The Adweek article explains, “When something is statistically significant, it means it wasn’t random luck. It means if you did it again, you’re likely to get the same result. It’s the necessary ingredient to building a repeatable playbook that systematically improves the effectiveness of your marketing.”
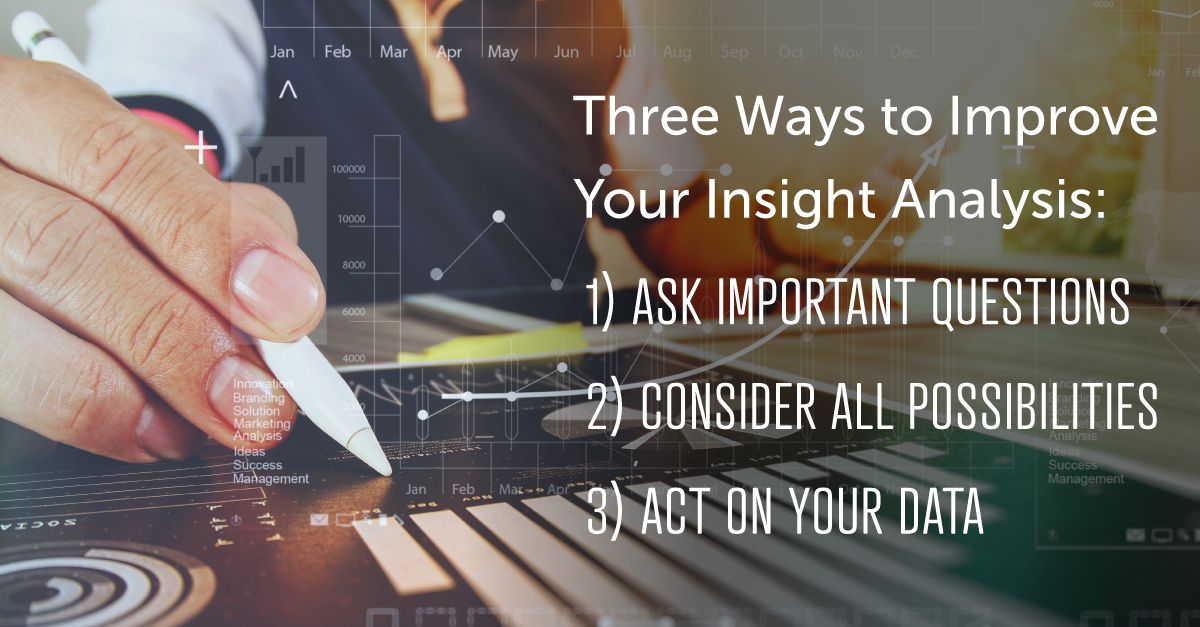
Three Ways to Improve Your Insight Analysis
1) Ask Important Questions
If you’re looking at reports and data, ask yourself, “Is this statistically significant?” When you’re asking deeper questions, if the person you’re asking doesn’t have an answer or seems to be lost, ask them to rerun the data or change the sample size.
2) Consider All Possibilities
Just because one ad with lemons in it performed well does not mean that the lemons were the key factor. You have to continue testing—try one ad with lemons, one without, and analyze from every angle.
3) Act on Your Data
This advice comes from Pestle Analysis, who says “Doing the analysis and finding all the information is pointless if you decide not to act on it. You gather all the data and analyze it. You come up with solutions and improvement ideas. But if you don’t implement those ideas, and implement them strategically, then it is pretty much a waste of your time and energy.”
Data is perhaps the most powerful tool a marketer can use, and those in the industry need to ensure that those who analyze and report the data do so accurately and responsibly.


